A selection of tools are used to enable activities to be executed in a planned order to ensure the efficient and effective execution of a programme of improvement.
Contents

Introduction
Tools are an important part of any toolkit, but are only as good as the people that use them and only effective when used to accomplish appropriate activities. Tools in the hands of novices may require careful instruction or benefit from some form of training or apprenticeship. Tools in the hands of experts may feel like an extension of the master working their trade, used for their intended purpose or adapted for other purposes. Tools are typically designed for a particular activity and optimised for the purpose, however, many may be usefully adopted for related tasks.
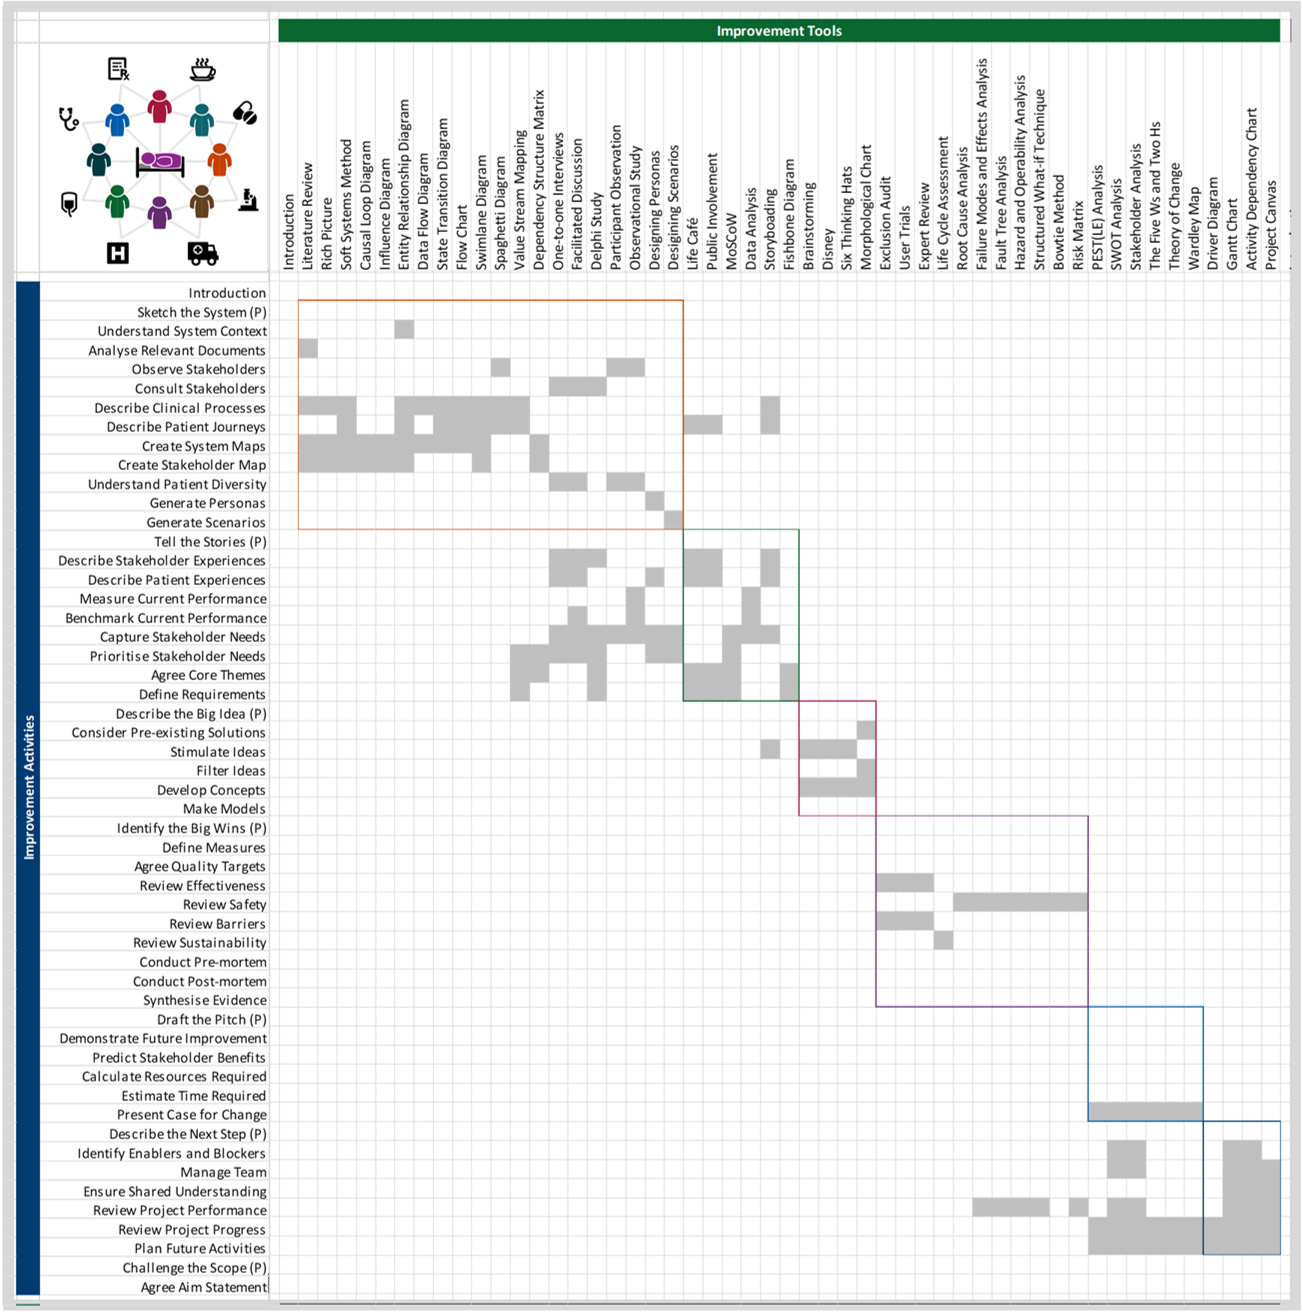
The tools in this toolkit are largely off-the-shelf, established and well used. Simple guidance is provided for their use and reference given to resources that describe them in more detail. The intention is not to provide full instructions for their use here, rather to point to their existence and indicate where they might be used. They are ordered according to their most likely contribution to the key strands of the Improvement Model that they relate to, but may be used at any stage. Hence the tools are presented in groups, aligned with the key strands.
Tools may be mapped to activities to assist in their selection. More than one tool may be used for any particular purpose and this is often encouraged. The mapping provides clear indication as to how tools might be used to support activities, but is not expected to exhaustively show where tools have actually been used in practice.
Text list of Tools
Context
- Literature Review
- Rich Picture
- Soft Systems Method
- Causal Loop Diagram
- Influence Map
- Entity Relationship Diagram
- Data Flow Diagram
- State Transition Diagram
- Flow Chart
- Swimlane Diagram
- Spaghetti Diagram
- Value Stream Mapping
- Dependency Structure Matrix
- One-to-one Interviews
- Facilitated Discussion
- Delphi Study
- Participant Observation
- Observational Study
- Designing Personas
- Designing Scenarios
Problem
Solution
Evidence
Pictorial list of Tools
You can click on any of the images below to find out more about that tool.
Cards for each of the tools are available in the boxed version of this toolkit. If you would like further information on how to get hold of these cards, please contact edc-toolkit@eng.cam.ac.uk
Context


Problem

Solution
Evidence


Case


Plan


Context
Literature Review
A systematic review of the literature describing the system being improved and its behaviour.
Top tips:
- Define relevant search terms and likely sources of literature
- Filter the literature retrieved to maximise its utility
- Search the grey literature for additional practical insights
https://www2.open.ac.uk/students/skillsforstudy/conducting-a-literature-review.php
Back to text list of Tools | Back to pictorial list of Tools

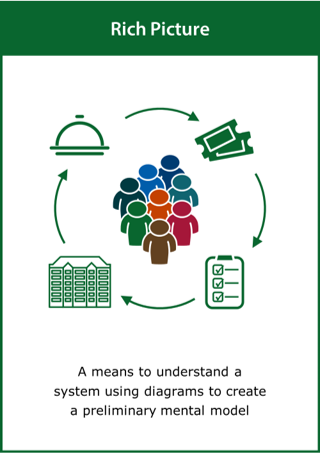
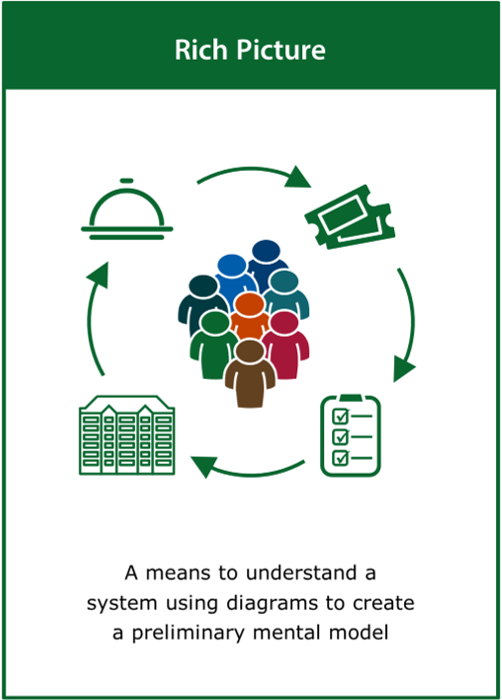
Rich Picture
A means to understand a system using diagrams to create a preliminary mental model
Top tips:
- Draw the time-invariant structures within the system
- Capture the activities and processes within the systems
- Identify the ways in which the structure and processes interact
https://www.open.edu/openlearn/science-maths-technology/engineering-technology/rich-pictures
Back to text list of Tools | Back to pictorial list of Tools
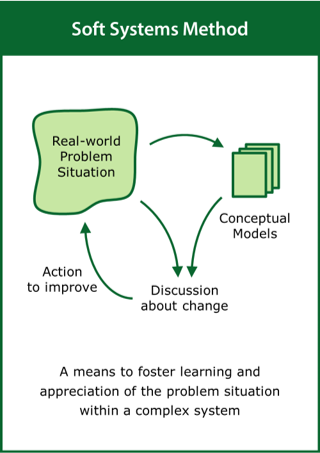
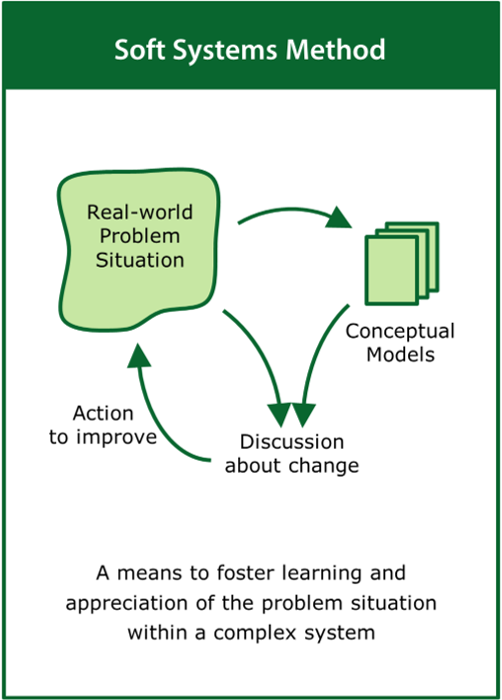
Soft Systems Method
A means to foster learning and appreciation of the problem situation within a complex system
Top tips:
- Look at the real-world situation rather than the problem
- Develop conceptual models to aid understanding of the system
- Define actions to improve that are shared by stakeholders
https://www.wiley.com/en-gb/Soft+Systems+Methodology+in+Action-p-9780471986058
Back to text list of Tools | Back to pictorial list of Tools
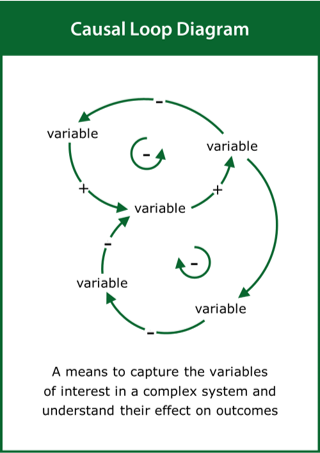
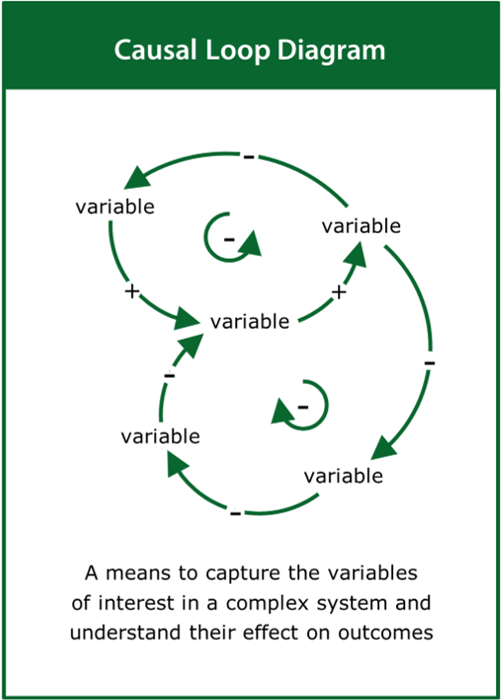
Causal Loop Diagram
A means to capture the variables of interest in a complex system and understand their effect on outcomes
Top tips:
- Identify the variables of interest and link them together
- Label and characterise the causal loops within the system
- Use the causal loops to tell the story of the system
https://thesystemsthinker.com/fine-tuning-your-causal-loop-diagrams-part-i/
Back to text list of Tools | Back to pictorial list of Tools
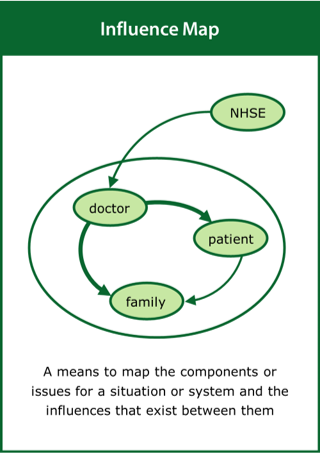
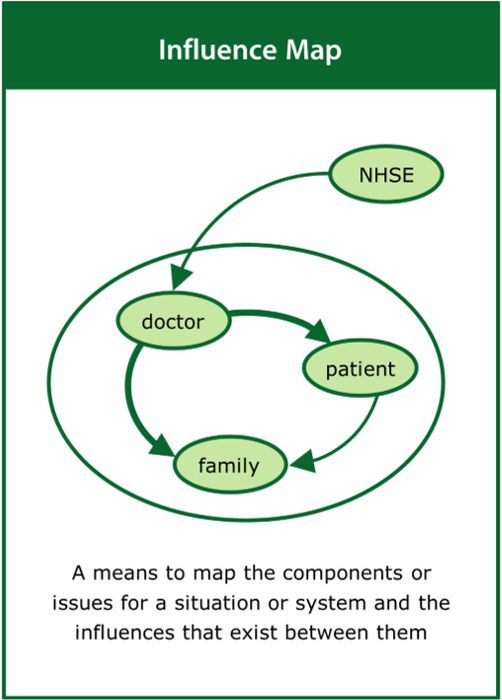
Influence Map
A means to map the components or issues for a situation or system and the influences that exist between them
Top tips:
- Identify the components and the influences between them
- Use different line thicknesses to indicate the levels of influence
- Explore the interrelationships and their effects on the system
Back to text list of Tools | Back to pictorial list of Tools
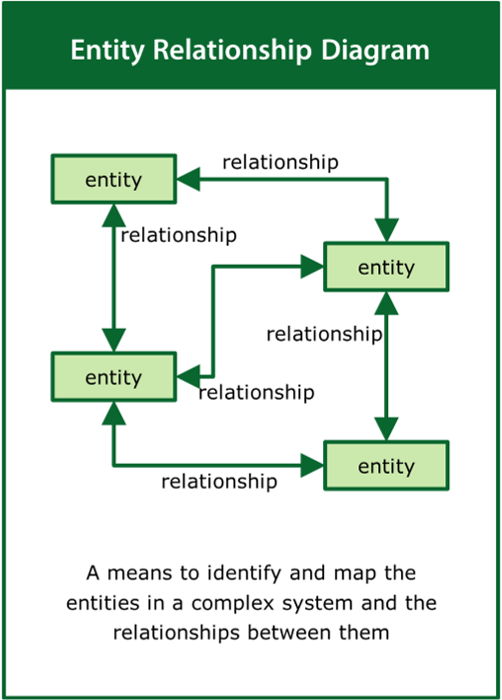
Entity Relationship Diagram
A means to identify and map the entities in a complex system and the relationships between them
Top tips:
- Look at the real-world situation rather than the problem
- Identify the entities and the nature of the relationships between them
- Use the relational loops to tell the story of the system
Back to text list of Tools | Back to pictorial list of Tools
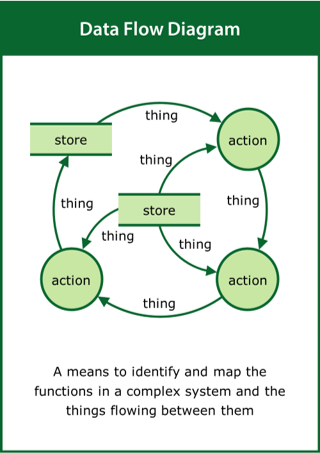
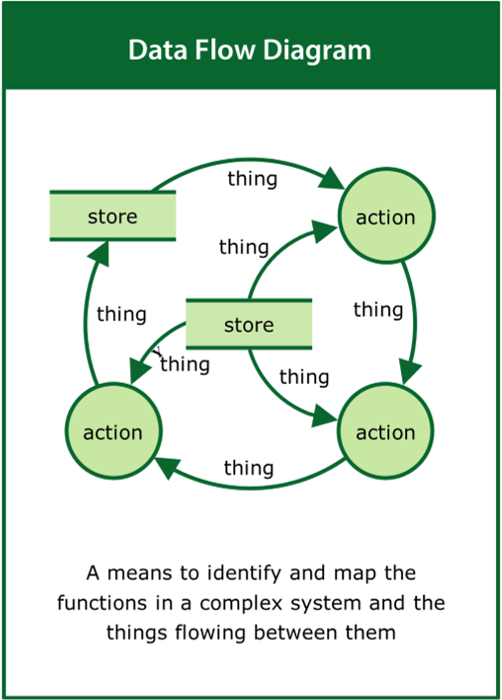
Data Flow Diagram
A means to identify and map the functions in a complex system and the things flowing between them
Top tips:
- Look at the real-world situation rather than the problem
- Identify the functions and the data/things flowing between them
- Use the function/data loops to tell the story of the system
Back to text list of Tools | Back to pictorial list of Tools
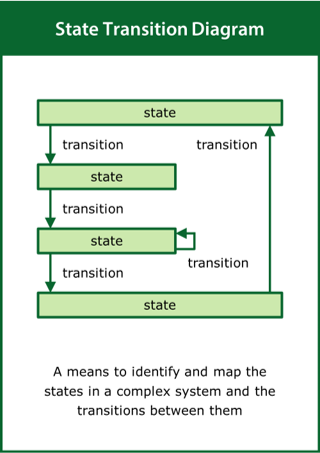
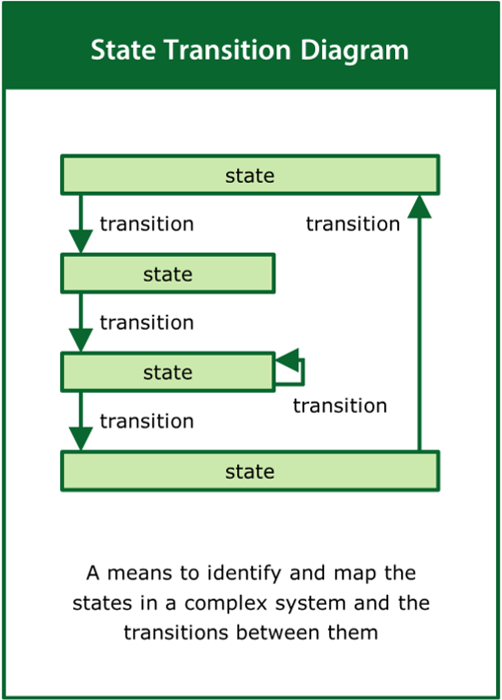
State Transition Diagram
A means to identify and map the states in a complex system and the transitions between them
Top tips:
- Look at the real-world situation rather than the problem
- Identify the states and nature of the transitions between them
- Use the transition loops to tell the story of the system
Back to text list of Tools | Back to pictorial list of Tools
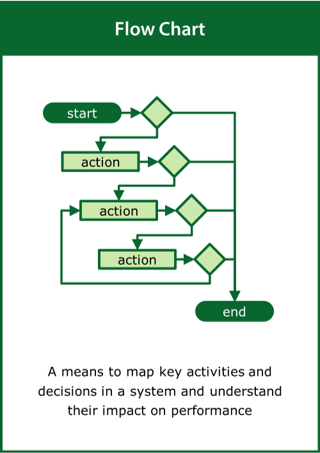
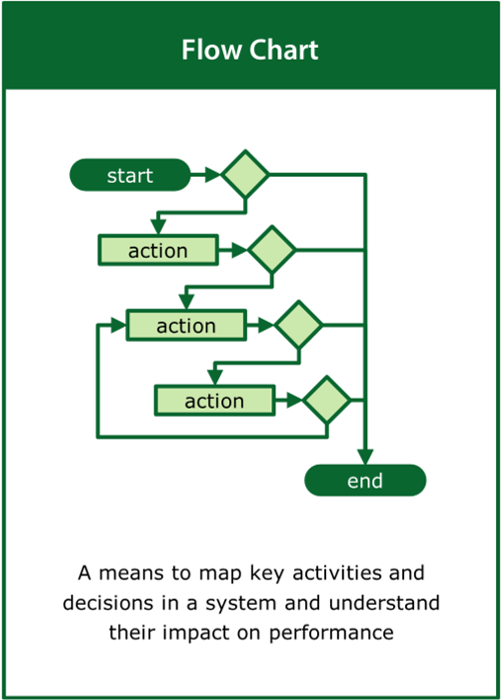
Flow Chart
A means to map the key activities and decisions in a system and understand their impact on performance
Top tips:
- Identify key activities in the system and the decisions that link them
- Look for unexpected feedback loops that may effect performance
- Identify the resources required to deliver the activities and decisions
Back to text list of Tools | Back to pictorial list of Tools
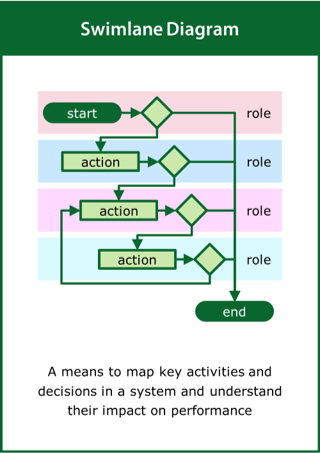
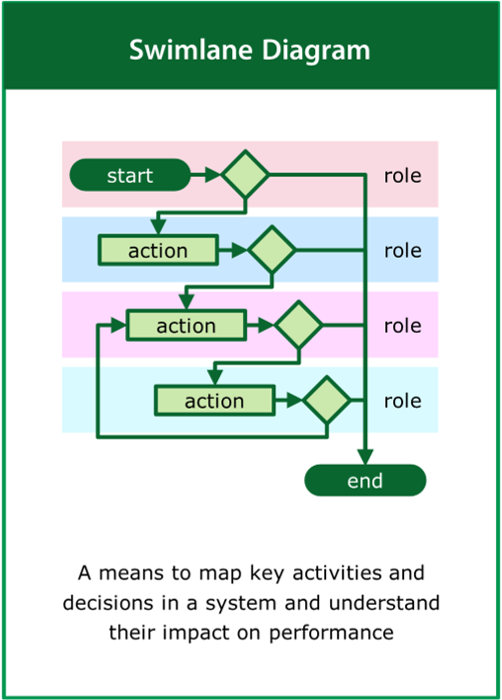
Swimlane Diagram
A means to map the key activities and decisions in a system and understand their impact on performance
Top tips:
- Identify key activities in the system and the decisions that link them
- Identify the resources required to deliver the activities and decisions
- Look for unexpected feedback loops that may effect performance
Back to text list of Tools | Back to pictorial list of Tools
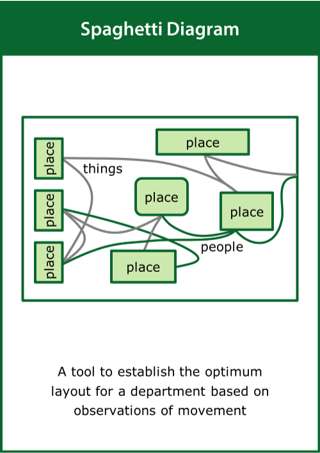
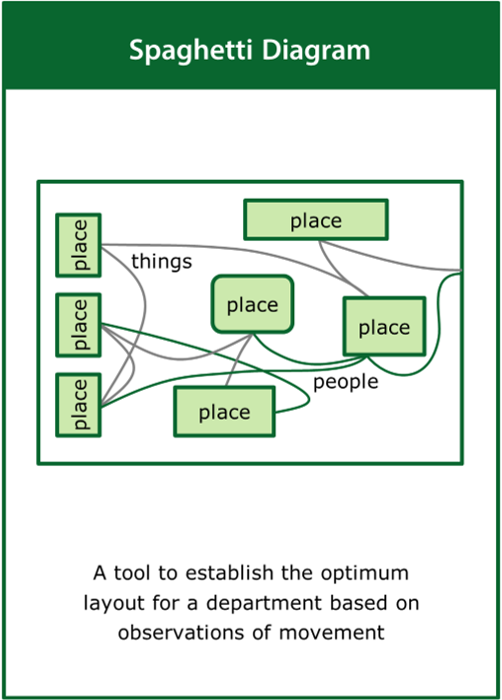
Spaghetti Diagram
A tool to establish the optimum layout for a department based on observations of movement
Top tips:
- Obtain a detailed floor plan of the department of interest
- Capture the movements of people or products within the department
- Analyse the lines of flow to identify unnecessary movement
https://www.england.nhs.uk/wp-content/uploads/2021/03/qsir-spaghetti-diagram.pdf
Back to text list of Tools | Back to pictorial list of Tools
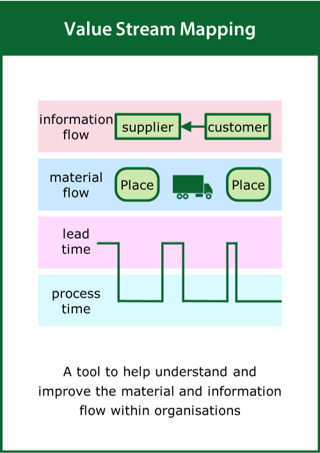
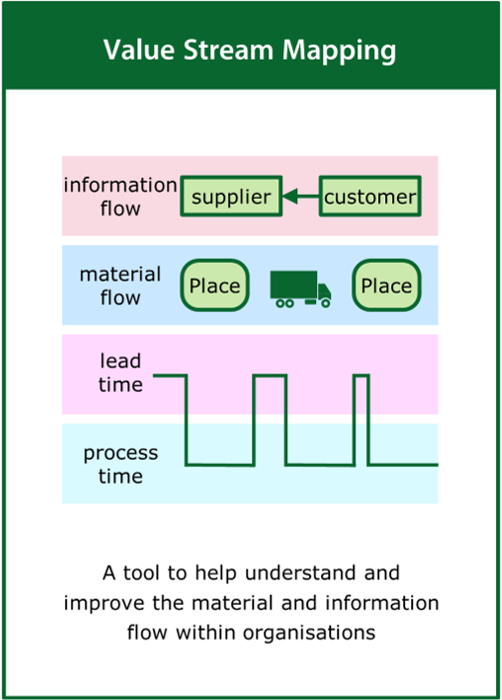
Value Stream Mapping
A tool to help understand and improve the material and information flow within organisations
Top tips:
- Present the whole process from end to end
- Use a simple graphical format to map current and future states
- Encourage a team approach to constructively critique activity
https://www.england.nhs.uk/wp-content/uploads/2021/03/qsir-value-stream-mapping.pdf
Back to text list of Tools | Back to pictorial list of Tools
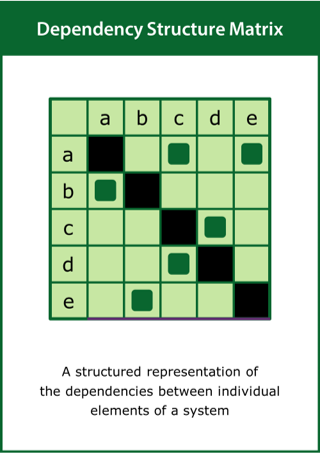
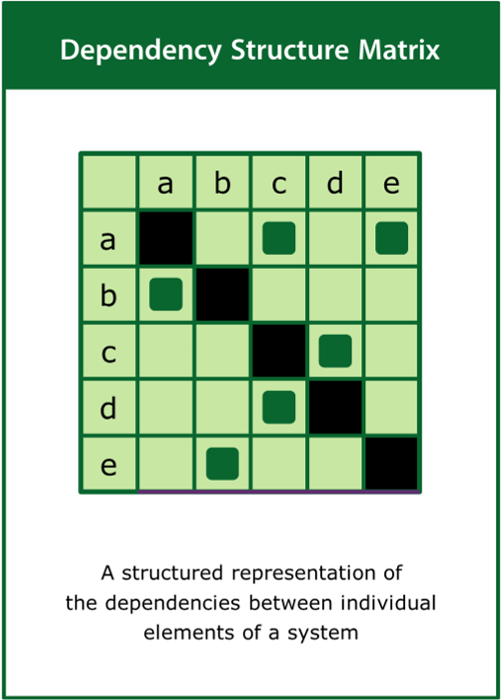
Dependency Structure Matrix
A structured representation of the dependencies between individual elements of a system
Top tips:
- Identify the relevant elements of the system and their dependencies
- Present the rows and columns of the matrix in the same order
- Apply clustering and sequencing algorithms to analyse the system
Back to text list of Tools | Back to pictorial list of Tools
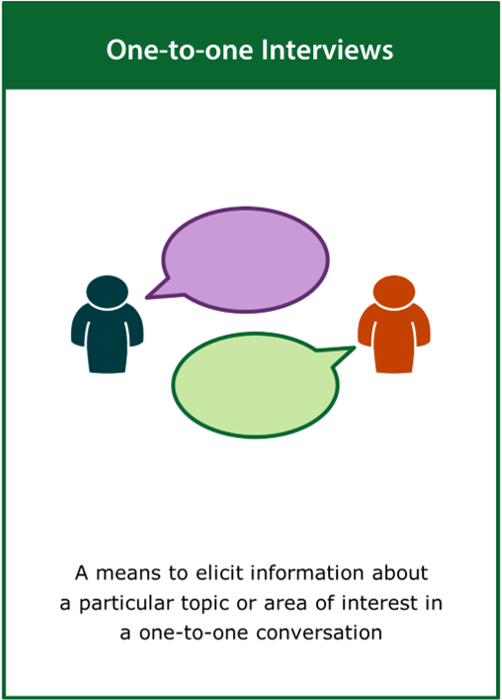
One-to-one Interviews
A means to elicit information about a particular topic or area of interest in a one-to-one conversation
Top tips:
- Select participants with a range of views on the chosen topic
- Prepare some key questions as the basis of the conversation
- Determine the degree of structure required before the interview
https://www.methods.manchester.ac.uk/themes/qualitative-methods/
Back to text list of Tools | Back to pictorial list of Tools
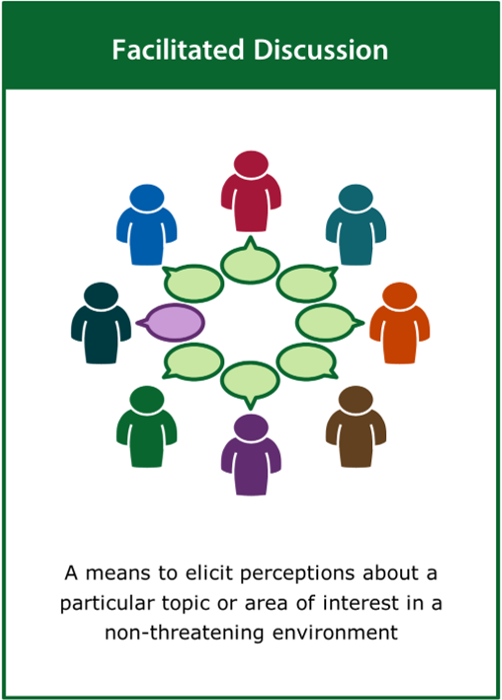
Facilitated Discussion
A means to elicit perceptions about a particular topic or area of interest in a non-threatening environment
Top tips:
- Select participants with a range of views on the chosen topic
- Encourage all participants to contribute to the discussion
- Use visualisation tools to summarise and communicate the results
https://www.methods.manchester.ac.uk/themes/data-collection/
Back to text list of Tools | Back to pictorial list of Tools
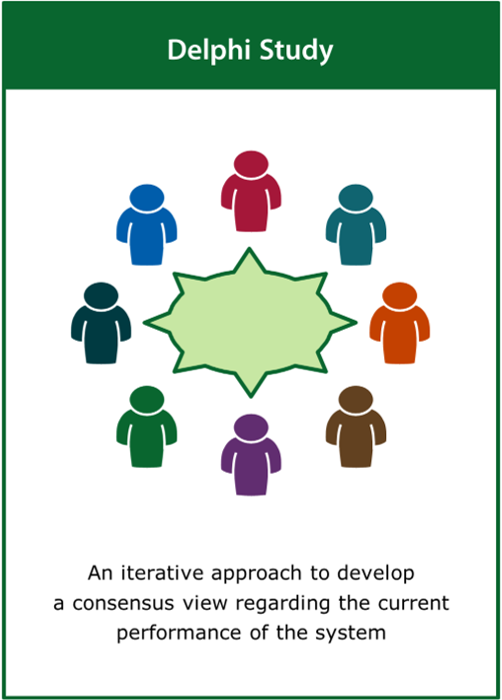
Delphi Study
An iterative approach to develop a consensus view regarding the current performance of the system
Top tips:
- Select experts with a range of views on the chosen topic
- Design the questionnaires to inform and elicit a consensus view
- Ensure a quick turnaround of views between the study cycles
https://www.rand.org/topics/delphi-method.html
Back to text list of Tools | Back to pictorial list of Tools
Participant Observation
A means to understand how things are really done in a particular situation or area of interest
Top tips:
- Design the study carefully to define its scope and appropriate duration
- Use ethnographic methods early in a programme of change
- Identify key activities, actions and detailed behaviours
https://www.methods.manchester.ac.uk/themes/ethnographic-methods/
Back to text list of Tools | Back to pictorial list of Tools
Observational Study
A means to observe how things are done in a particular situation or area of interest
Top tips:
- Design the study carefully to define its scope and appropriate duration
- Use observational methods early in a programme of change
- Identify key activities, actions and detailed behaviours
https://www.methods.manchester.ac.uk/themes/qualitative-methods/
Back to text list of Tools | Back to pictorial list of Tools
Designing Personas
A means to create representations of stereotypical users and their conditions, capabilities and responsibilities
Top tips:
- Conduct user research to identify key users and their behaviours
- Focus on the expectations, needs and motivations of key users
- Describe realistic people with backgrounds, goals and values
https://www.usabilitybok.org/persona
Back to text list of Tools | Back to pictorial list of Tools
Designing Scenarios
A means to create the stories of stereotypical users reflecting their conditions, capabilities and responsibilities
Top tips:
- Conduct user research to identify key stories and their context
- Focus on the expectations, needs and motivations of key users
- Describe realistic scenarios involving stereotypical users
https://www.usabilitybok.org/scenario-of-use
Back to text list of Tools | Back to pictorial list of Tools
Problem
Life Café
A means to elicit an understanding of the needs for a system, taking account of the full range of stakeholders
Top tips:
- Enable community members to express what matters to them
- Generate conversations within a safe and familiar environment
- Tailor the experience for different people, situations or environments
Back to text list of Tools | Back to pictorial list of Tools

Public Involvement
A means to encourage and ensure patient and public involvement in quality improvement projects
Top tips:
- Identify key patient and public groups to be involved
- Co-design all activities to maximise engagement and value
- Ensure that ethical approval is obtained for all activities
https://www.bma.org.uk/media/1938/bma-patient-and-public-involvement-2015.pdf
Back to text list of Tools | Back to pictorial list of Tools
MoSCoW
A means to capture a prioritised list of must, should, could and won’t have requirements for improvement
Top tips:
- Capture the requirements that must be met
- Identify those requirements that should or could be met
- List those requirements that would be required later
https://www.toolshero.com/project-management/moscow-method/
Back to text list of Tools | Back to pictorial list of Tools
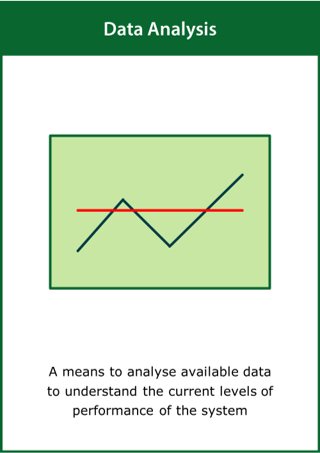
Data Analysis
A means to analyse available data to understand the current levels of performance of the system
Top tips:
- Collect relevant performance data across the systems of interest
- Select the analytical tools most appropriate to explore the data
- Use visualisation tools to summarise and communicate the results
https://www.methods.manchester.ac.uk/themes/survey-and-statistical-methods/
Back to text list of Tools | Back to pictorial list of Tools
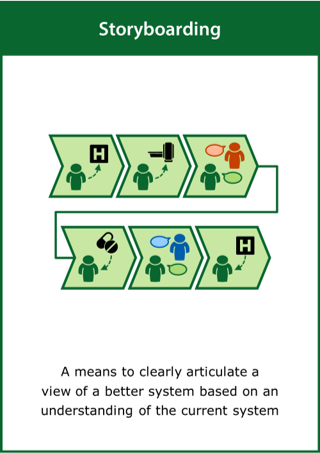
Storyboarding
A means to clearly articulate a view of a better system based on an understanding of the current system
Top tips:
- Identify all the key steps in the end-to-end patient journey
- Make each step small enough to elicit subtle but significant issues
- Look at each step from different stakeholder perspectives
https://www.toolshero.com/problem-solving/storyboarding/
Back to text list of Tools | Back to pictorial list of Tools
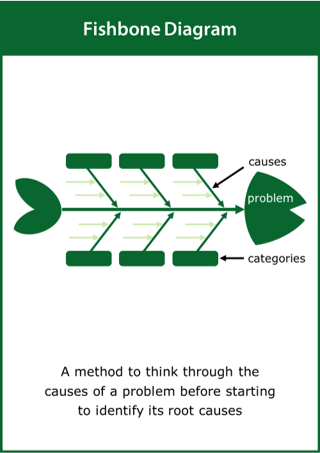
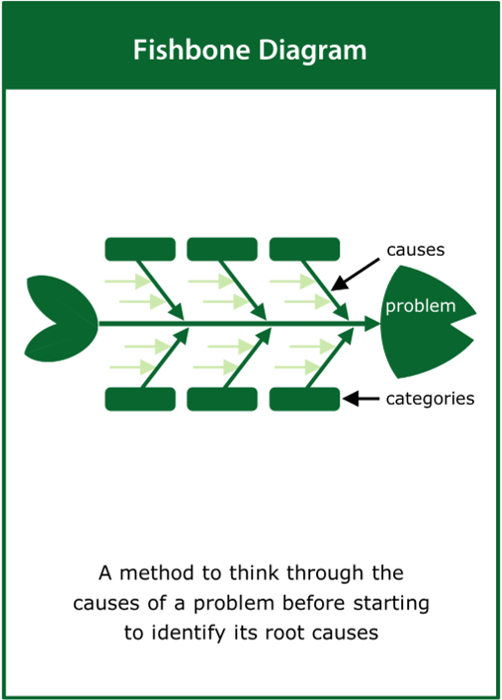
Fishbone Diagram
A method to think through the causes of a problem before starting to identify its root causes
Top tips:
- Define the main problem to be resolved
- Identify the main categories of potential causes
- Allow progressive identification of the most likely causes
https://www.england.nhs.uk/wp-content/uploads/2021/12/qsir-cause-and-effect-fishbone.pdf
Back to text list of Tools | Back to pictorial list of Tools
Solution
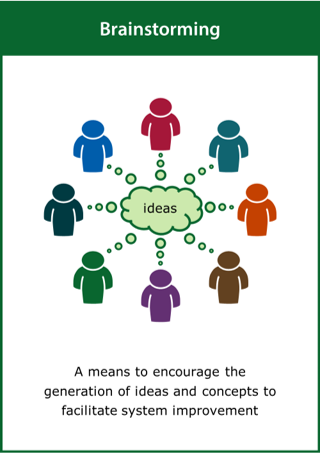
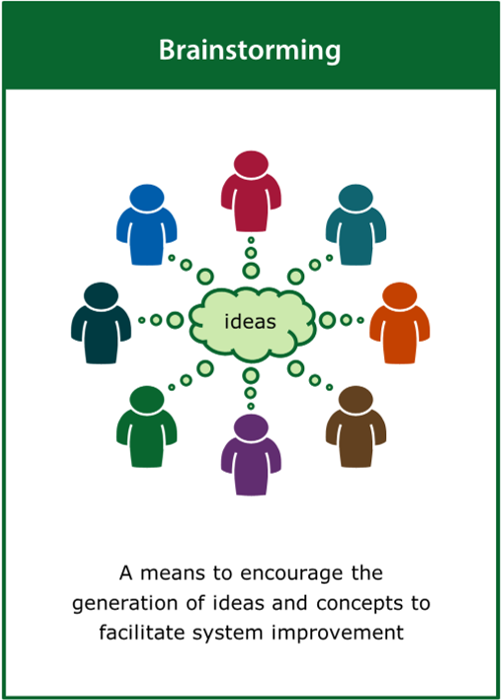
Brainstorming
A means to encourage the generation of ideas and concepts to facilitate system improvement
Top tips:
- Encourage free thinking in the generation of ideas and concepts
- Focus initially on the quantity of ideas and concepts created
- Filter the ideas and concepts to identify potential winners
https://www.ifm.eng.cam.ac.uk/research/dstools/brainstorming/
Back to text list of Tools | Back to pictorial list of Tools
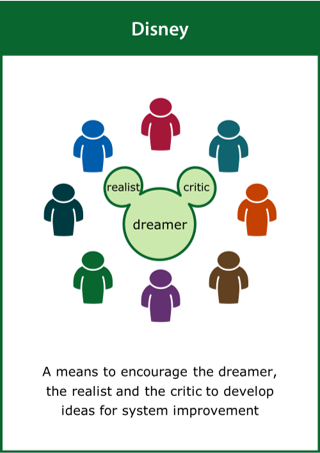
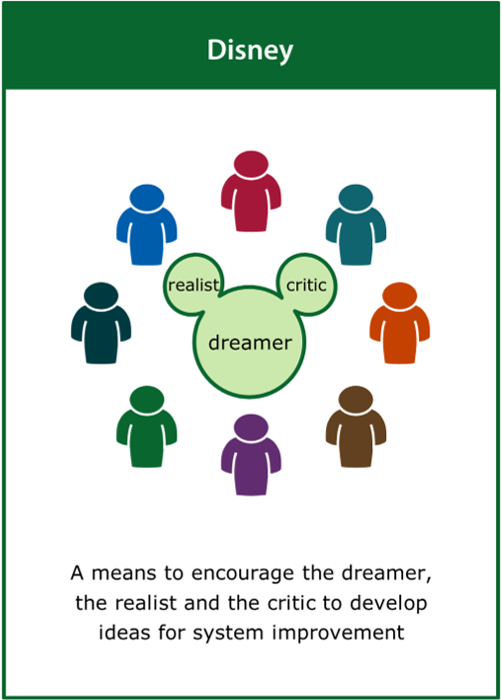
Disney
A means to encourage the dreamer, the realist and the critic to develop ideas for system improvement
Top tips:
- Allow the sharing of dreams without restriction or criticism
- Filter ideas to turn imaginary ideas into a manageable action plan
- Provide constructive critique for the ideas and action plan
https://www.toolshero.com/creativity/walt-disney-method/
Back to text list of Tools | Back to pictorial list of Tools
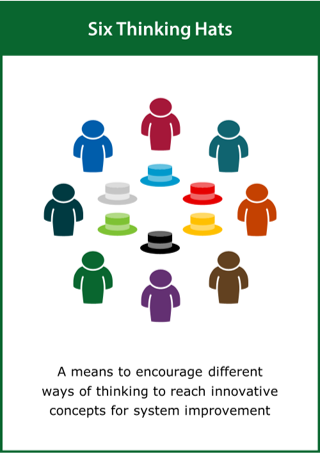
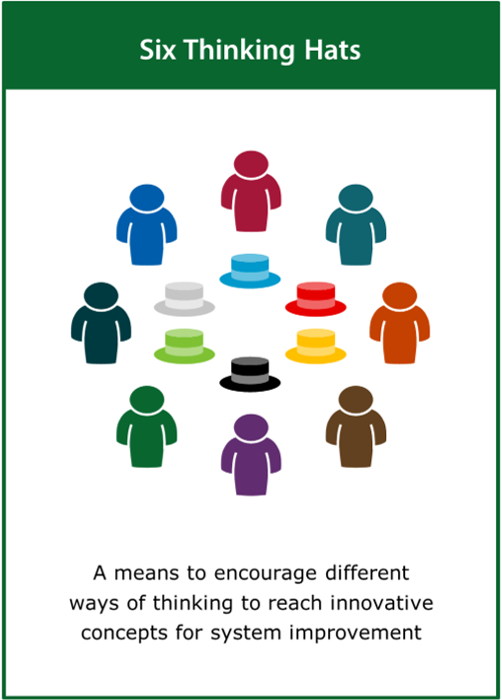
Six Thinking Hats
A means to encourage different ways of thinking to reach innovative concepts for system improvement
Top tips:
- Establish the facts and encourage intuitive thinking
- Allow a structured mix of creative, constructive and cautious thinking
- Facilitate and manage the critical thinking discussions
https://www.england.nhs.uk/wp-content/uploads/2022/02/qsir-six-thinking-hats.pdf
Back to text list of Tools | Back to pictorial list of Tools
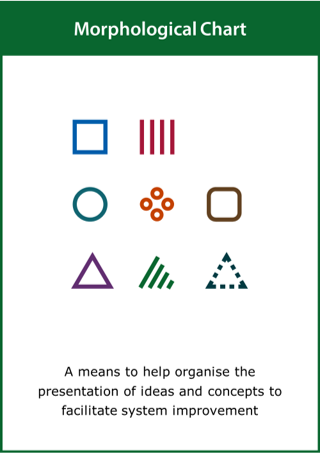
Morphological Chart
A means to help organise the presentation of ideas and concepts to facilitate system improvement
Top tips:
- Encourage free thinking in the generation of ideas and concepts
- Arrange the ideas and concepts in organisational or functional groups
- Create potential solutions as combinations of ideas and concepts
https://www.ifm.eng.cam.ac.uk/research/dmg/tools-and-techniques/morphological-charts/
Back to text list of Tools | Back to pictorial list of Tools
Evidence
Exclusion Audit
A systematic approach to estimating potential levels of exclusion when using a system
Top tips:
- Identify the location and cause of potential exclusion
- Estimate the likelihood and impact of potential exclusion
- Assess the risk of exclusion and determine its criticality
http://www.inclusivedesigntoolkit.com/GS_evaluate/evaluate.html#exclusion
Back to text list of Tools | Back to pictorial list of Tools
User Trials
An experimental approach to identifying potential causes of difficulty when using a system
Top tips:
- Observe the location and cause of actual challenges
- Estimate the likelihood and impact of actual challenges
- Assess the risk of challenges and determine their criticality
http://www.inclusivedesigntoolkit.com/GS_evaluate/evaluate.html#testuser
Back to text list of Tools | Back to pictorial list of Tools
Expert Review
A systematic approach to identifying potential causes of difficulty when using a system
Top tips:
- Identify the location and cause of potential challenges
- Estimate the likelihood and impact of potential challenges
- Assess the risk of challenges and determine their criticality
http://www.inclusivedesigntoolkit.com/GS_evaluate/evaluate.html#experts
Back to text list of Tools | Back to pictorial list of Tools
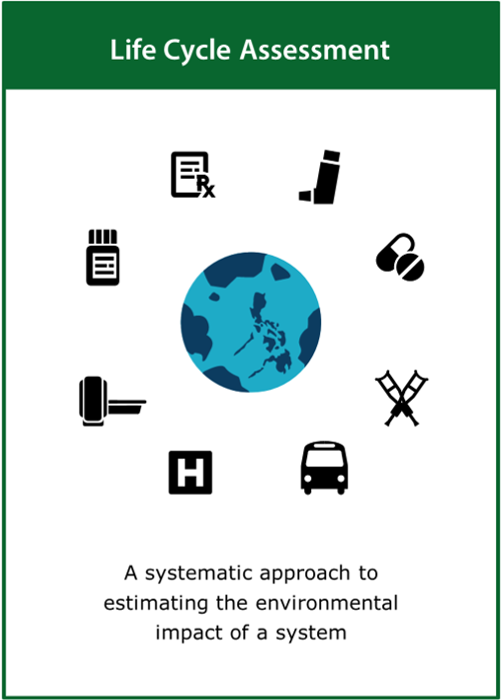
Life Cycle Assessment
A systematic approach to estimating the environmental impact of a system
Top tips:
- Specify the system boundary and baseline for the analysis
- Assess the impact of the system at all stages of its lifecycle
- Develop a strategy for reducing environmental impact
Back to text list of Tools | Back to pictorial list of Tools
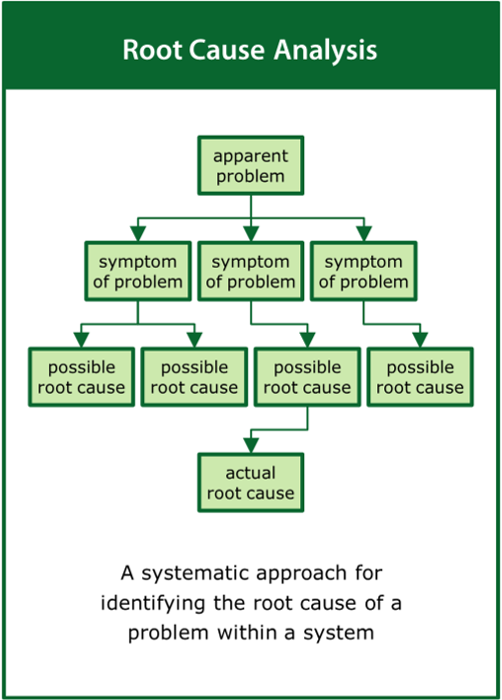
Root Cause Analysis
A systematic approach for identifying the root cause of a problem within a system
Top tips:
- Define the problem and its impact on different stakeholders
- Identify possible causal factors and the real reason for the problem
- Recommend solutions to prevent the problem from happening again
Back to text list of Tools | Back to pictorial list of Tools
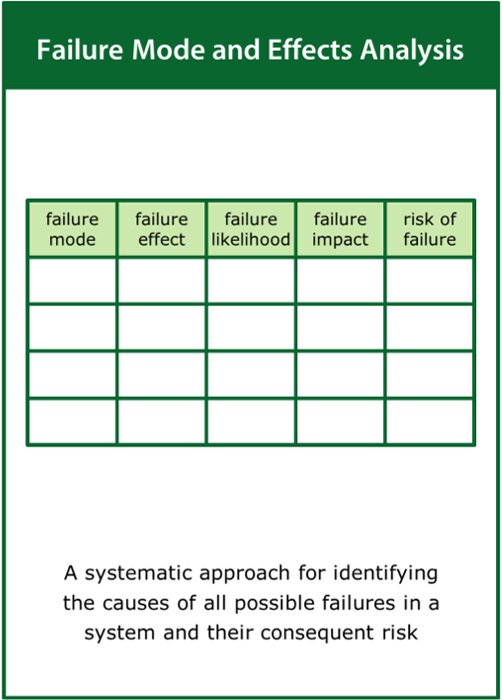
Failure Modes and Effects Analysis
A systematic approach for identifying the causes of all possible failures in a system and their consequent risk
Top tips:
- Identify the location and cause of potential failure modes
- Estimate the likelihood and impact of potential failure modes
- Assess the risk of potential failure modes and determine their criticality
https://www.iso.org/standard/72140.html
Back to text list of Tools | Back to pictorial list of Tools
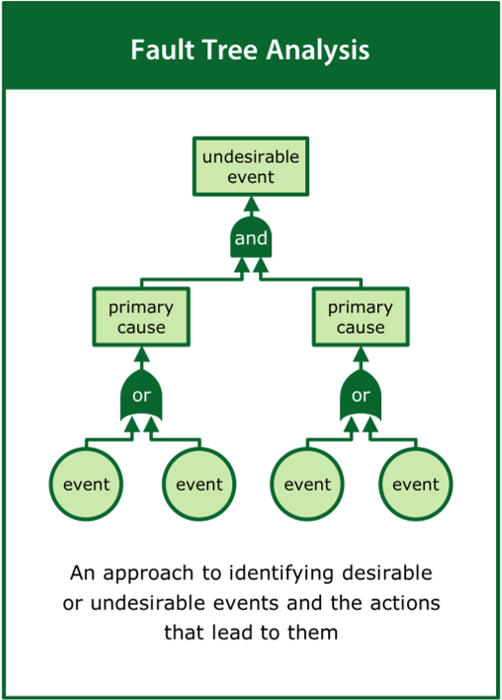
Fault Tree Analysis
An approach to identifying desirable or undesirable events and the combinations of actions that lead to them
Top tips:
- Identify key events representing success or failure
- Map the combinations of actions that may lead to these events
- Estimate the likelihood of the actions and consequent events
https://www.iso.org/standard/72140.html
Back to text list of Tools | Back to pictorial list of Tools
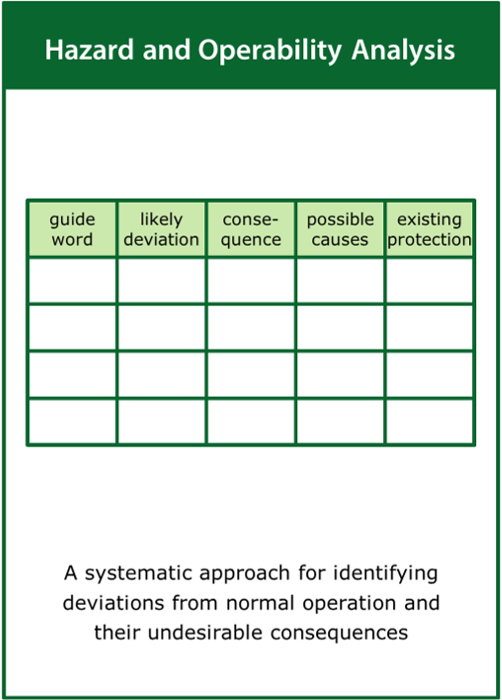
Hazard and Operability Analysis
A systematic approach for identifying deviations from normal operation and their undesirable consequences
Top tips:
- Identify and quantify key flows within the system
- Investigate a range of possible deviations from normal operation
- Estimate the impact of deviations on system operation
https://www.iso.org/standard/72140.html
Back to text list of Tools | Back to pictorial list of Tools
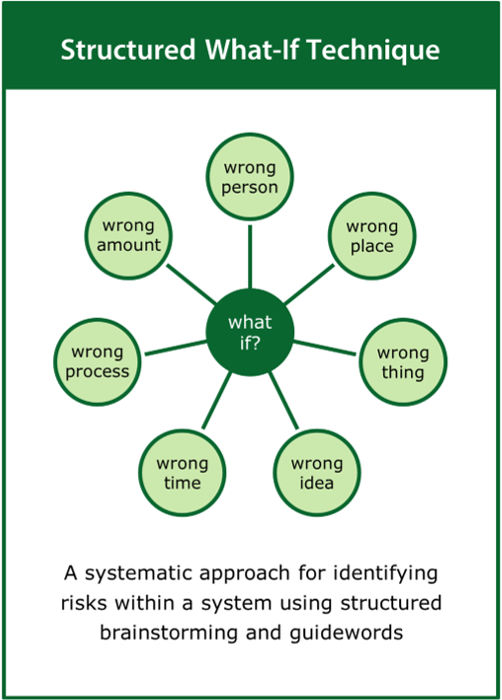
Structured What-If Technique
A systematic approach for identifying risks within a system using structured brainstorming and guidewords
Top tips:
- Identify and quantify key flows within the system
- Use a suitable list of prompts to initiate discussion of potential risks
- Involve a multidisciplinary team of experts in the review
https://www.iso.org/standard/72140.html
Back to text list of Tools | Back to pictorial list of Tools
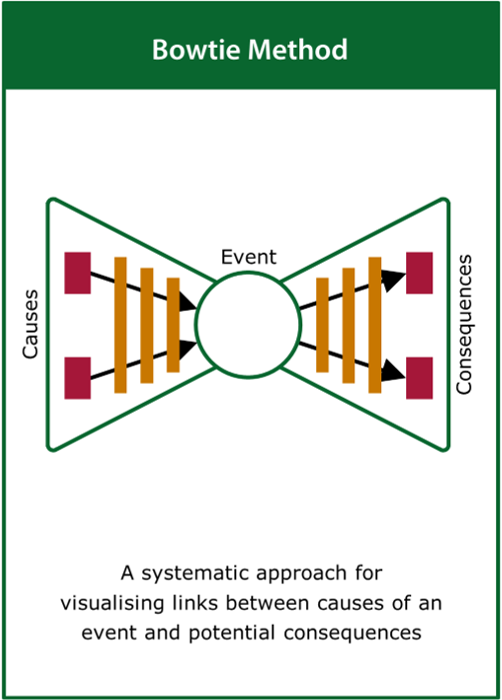
Bowtie Method
A systematic approach for identifying deviations from normal operation and their undesirable consequences
Top tips:
- Identify a key ‘top event’ associated with the system
- Add causes (threats) to the left and consequences to the right
- Overlay any preventative and mitigation barriers
Back to text list of Tools | Back to pictorial list of Tools
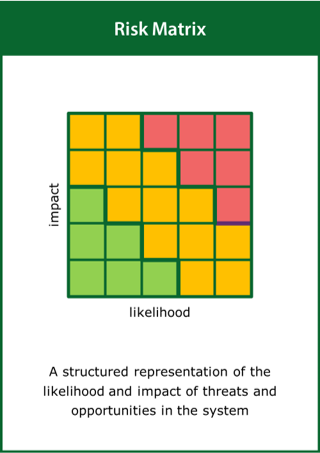
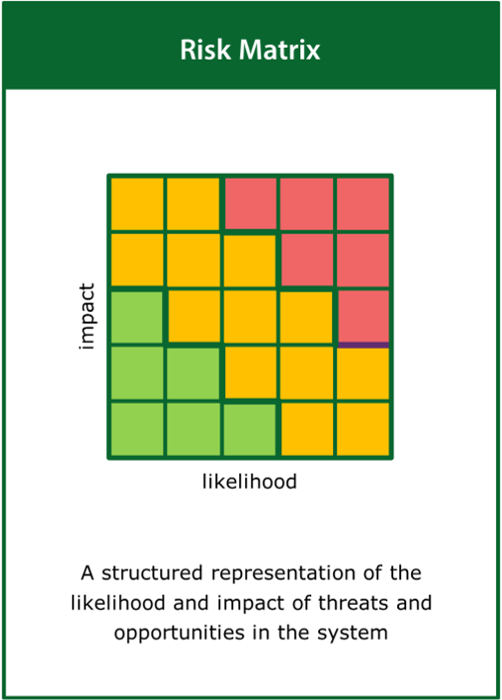
Risk Matrix
A structured representation of the likelihood and impact of threats and opportunities in the system
Top tips:
- Quantify possible threats and opportunities
- Map the likelihood and impact of the threats and opportunities
- Identify unacceptable threats to the system performance
https://www.iso.org/standard/72140.html
Back to text list of Tools | Back to pictorial list of Tools
Case
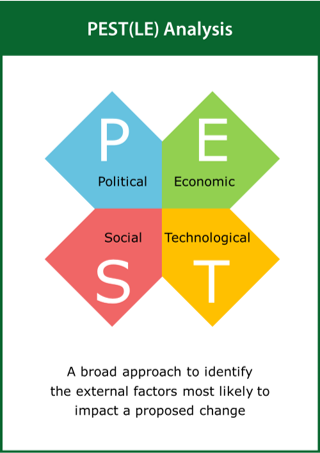
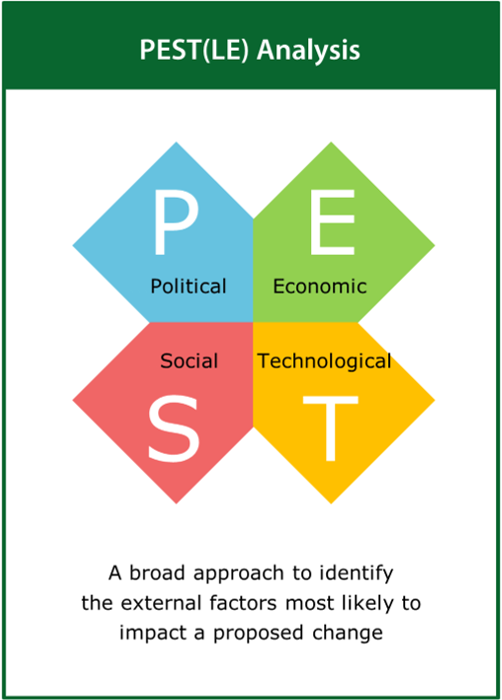
PEST(LE) Analysis
A broad approach to identify the external factors most likely to impact a proposed change
Top tips:
- Consider the external factors associated with a proposed change
- Add environmental and legal factors to conduct a PESTLE
- Use the results of the analysis as input to a SWOT analysis
https://www.professionalacademy.com/blogs-and-advice/marketing-theories---pestel-analysis
Back to text list of Tools | Back to pictorial list of Tools
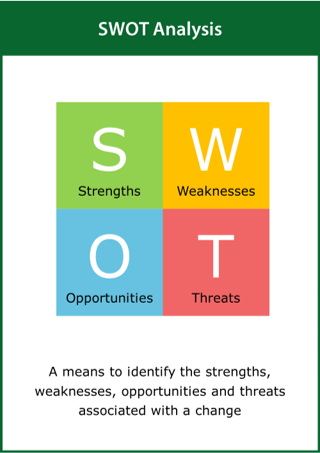
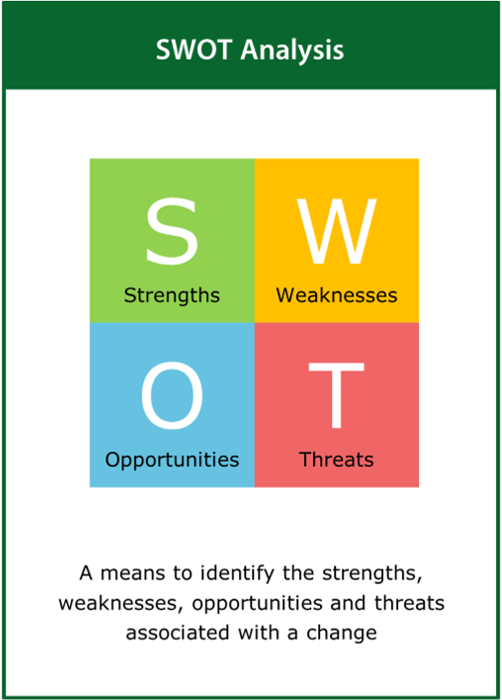
SWOT Analysis
A means to identify the strengths, weaknesses, opportunities and threats associated with a change
Top tips:
- Consider the external factors involved with a proposed change
- Use the results of a PEST analysis as input to the SWOT analysis
- Set the final change objective following the SWOT analysis
https://www.professionalacademy.com/blogs-and-advice/marketing-theories---swot-analysis
Back to text list of Tools | Back to pictorial list of Tools
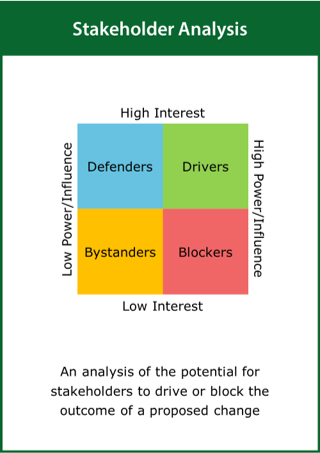
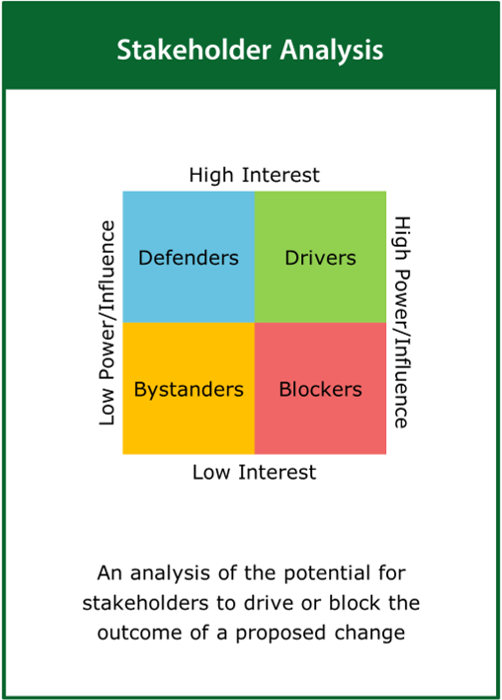
Stakeholder Analysis
An analysis of the potential for stakeholders to drive or block the outcome of a proposed change
Top tips:
- Identify drivers and blockers likely to influence a proposed change
- Develop a strategy to engage with the key influencers
- Ensure good communication with all stakeholders
https://www.professionalacademy.com/blogs/mendelows-matrix-marketing-theories/
Back to text list of Tools | Back to pictorial list of Tools
The Five Ws and Two Hs
A means to summarise the rational for and initial description of a proposed change
Top tips:
- Answer the who, what, where, when and why simply and clearly
- Describe how the change will be delivered and how much it will cost
- Use this approach to support other problem solving challenges
Back to text list of Tools | Back to pictorial list of Tools

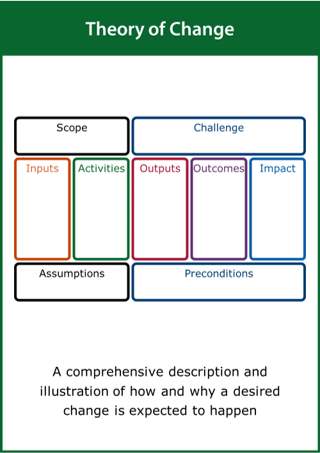
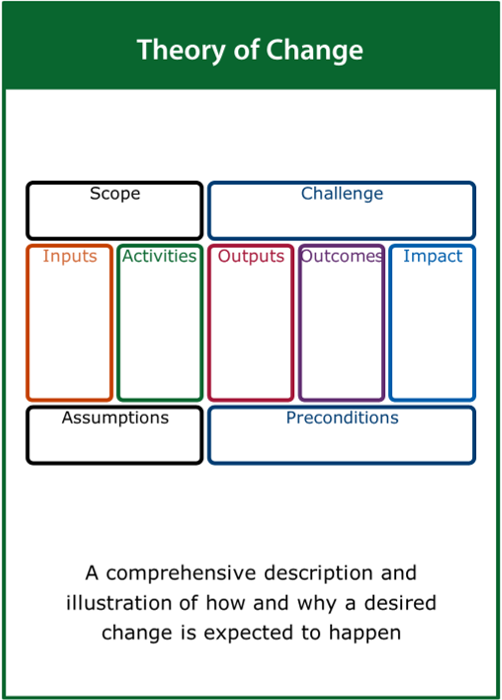
Theory of Change
A comprehensive description and illustration of how and why a desired change is expected to happen
Top tips:
- Define the scope of the improvement challenge
- Identify the key activities, deliverables and impact
- Record the assumptions and preconditions required
https://www.theoryofchange.org/
Back to text list of Tools | Back to pictorial list of Tools
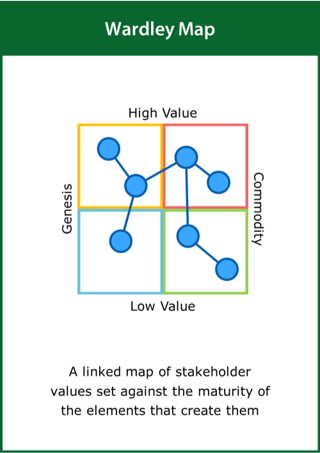
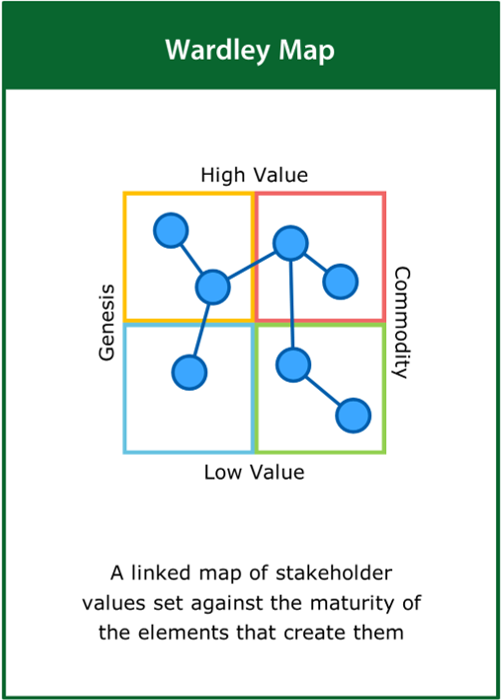
Wardley Map
A linked map of stakeholder values set against the maturity of the elements that create them
Top tips:
- Identify the key components of stakeholder value
- Map value against the maturity of the elements that produce it
- Connect components on the map that are linked in any way
https://blog.gardeviance.org/2015/02/an-introduction-to-wardley-value-chain.html
Back to text list of Tools | Back to pictorial list of Tools
Plan
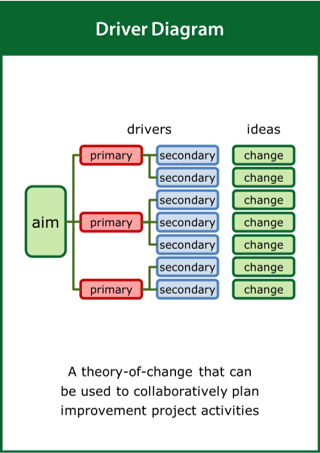
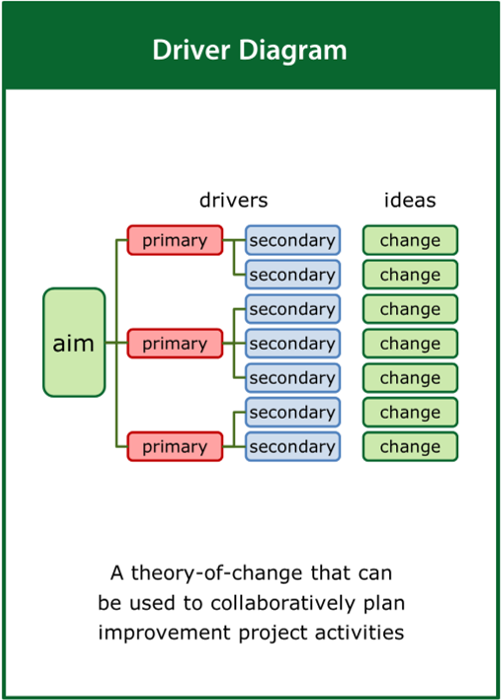
Driver Diagram
A theory-of-change that can be used to collaboratively plan improvement project activities
Top tips:
- Capture a clearly defined and measurable aim
- Identify the drivers which will contribute to the aim
- Formulate the ideas for change designed to meet the aim
https://www.england.nhs.uk/wp-content/uploads/2021/03/qsir-driver-diagrams.pdf
Back to text list of Tools | Back to pictorial list of Tools
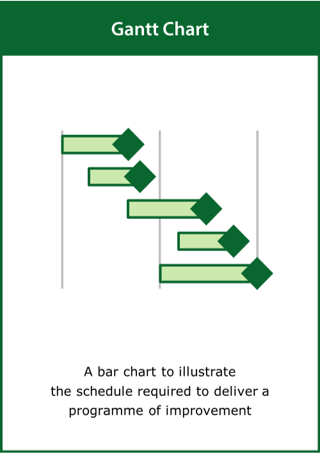
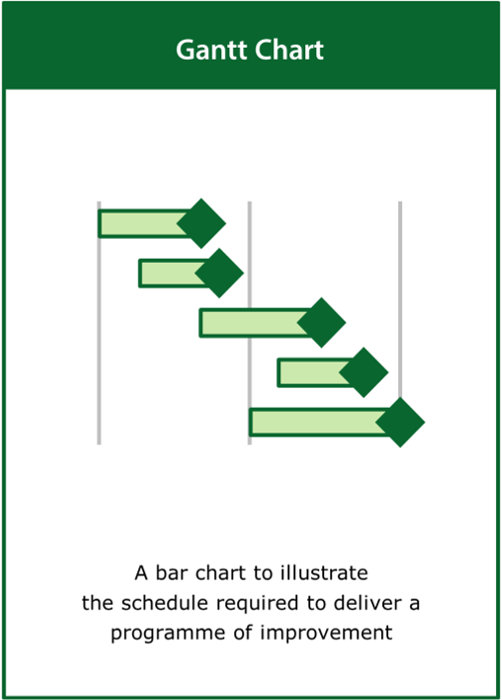
Gantt Chart
A bar chart to illustrate the schedule required to deliver a programme of improvement
Top tips:
- Identify the key activities and deliverables
- Show dependencies if appropriate to illustrate task precedencies
- Cluster the activities by function or in order of start time
https://www.ifm.eng.cam.ac.uk/research/dstools/graphs-gantt-histograms-bar-charts/
Back to text list of Tools | Back to pictorial list of Tools
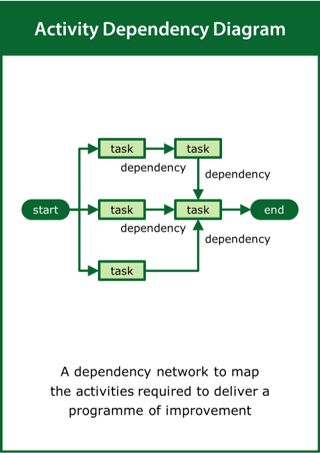
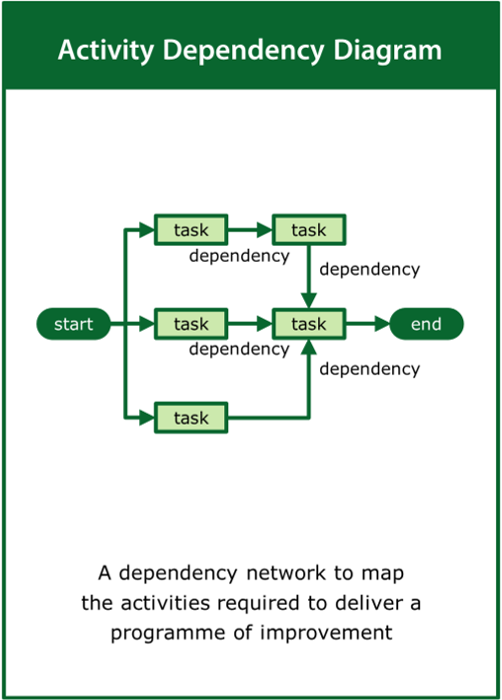
Activity Dependency Diagram
A dependency network to map the activities required to deliver a programme of improvement
Top tips:
- Identify the key activities and deliverables
- Order the activities taking account of their precedencies
- Determine the critical path required to deliver the programme
https://www.ifm.eng.cam.ac.uk/research/dstools/pert/
Back to text list of Tools | Back to pictorial list of Tools
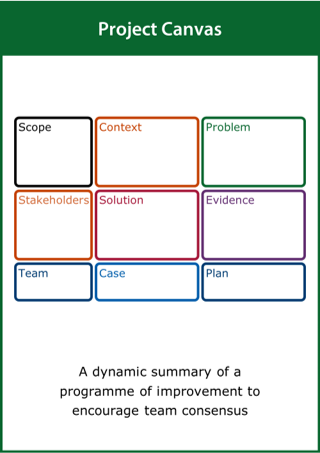
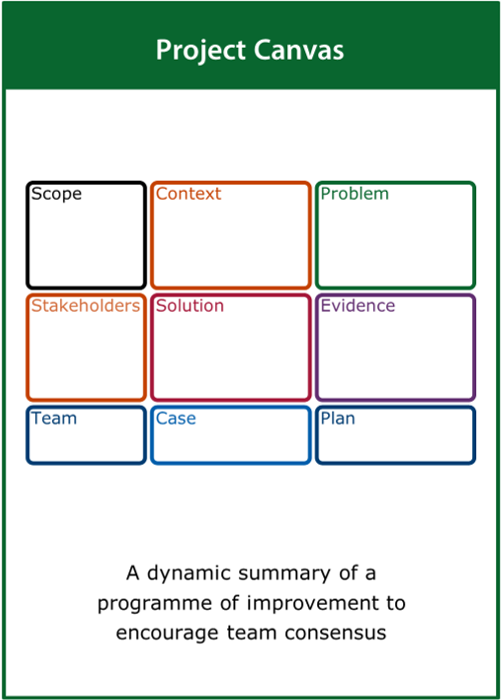
Project Canvas
A dynamic summary of a programme of improvement to encourage team consensus
Top tips:
- Capture what is known about all elements of the project
- Start with what you know and then fill in the gaps
- Update the canvas as the project progresses
http://www.projectcanvas.dk/project-canvas-manual.pdf
Back to text list of Tools | Back to pictorial list of Tools
Feedback
We would welcome your feedback on this page:
Privacy policy. If your feedback comments warrant follow-up communication, we will send you an email using the details you have provided. Feedback comments are anonymized and then stored on our file server
Read more about how we use your personal data. Any e-mails that are sent or received are stored on our mail server for up to 24 months.